Nu-Link2-Pro
ETM: Embedded Trace Macrocell
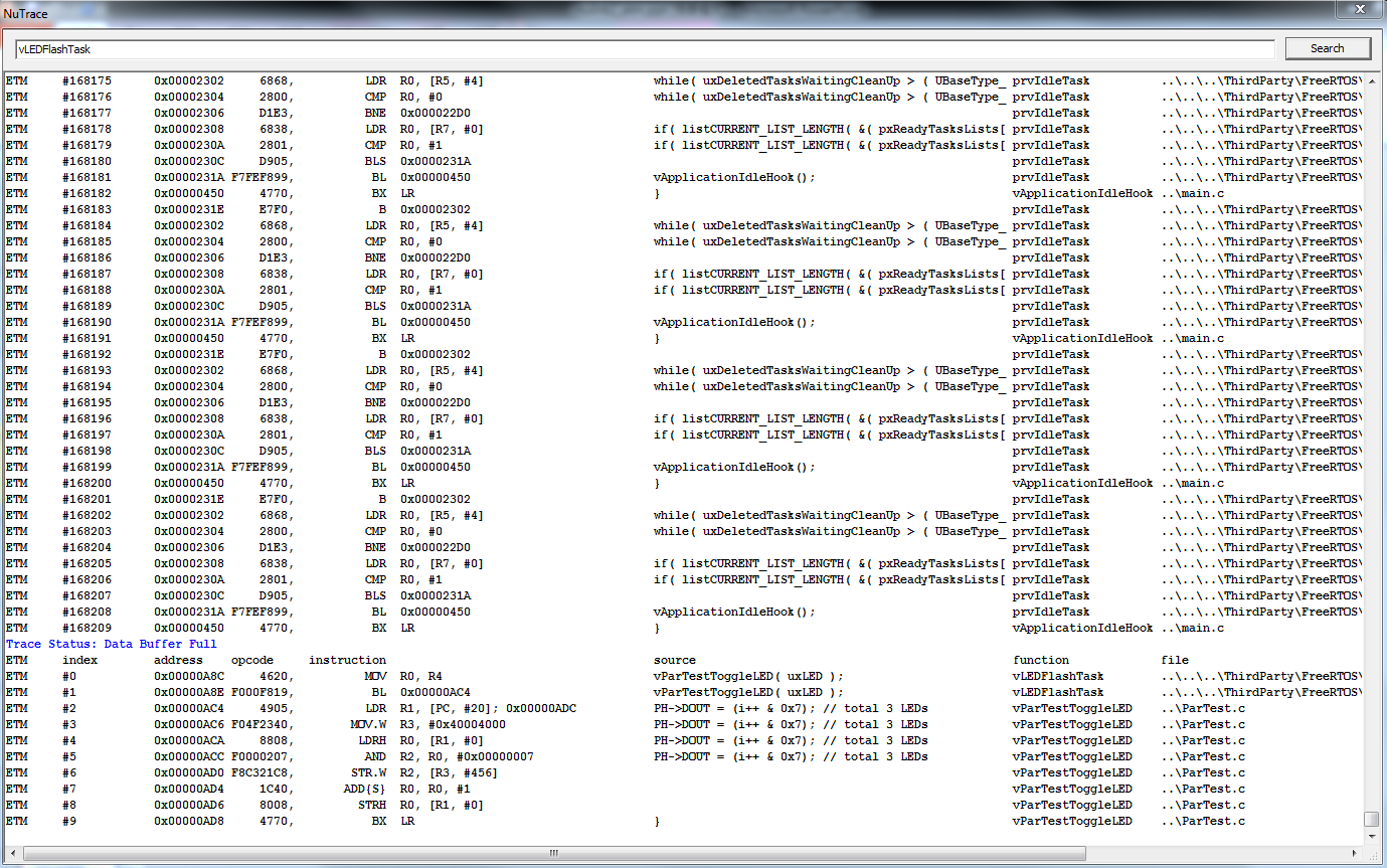
- ETM provides instructions log: clear program flow.
- PC, data Read/ Writes, exceptions, timestamp are displayed.
- Triggers and Filter can filter out stuff we don’t want to see.
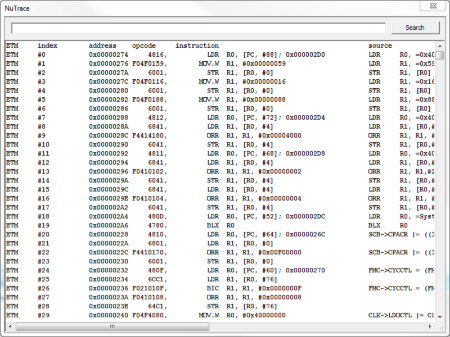
- Assembly and C source code are displayed.
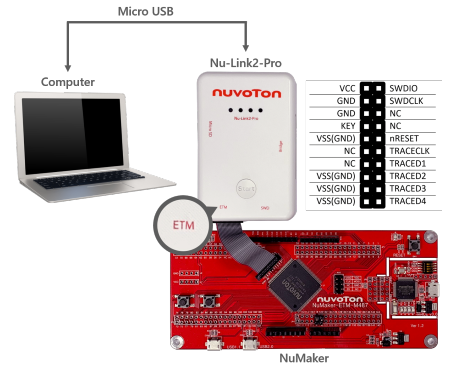
To start Embedded Trace Macrocell (ETM) tracing on Nuvoton Cortex®-M4/M23 devices, please connect to the device using the Nu-Link2-Pro with 20-pin connector as shown in the figure below and then follow the steps below.
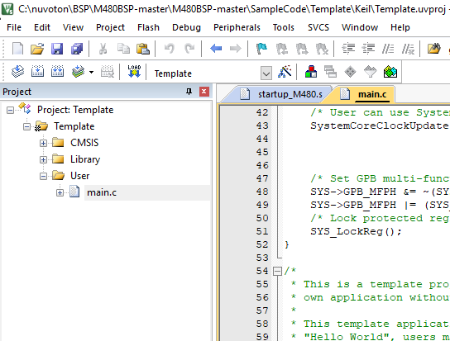
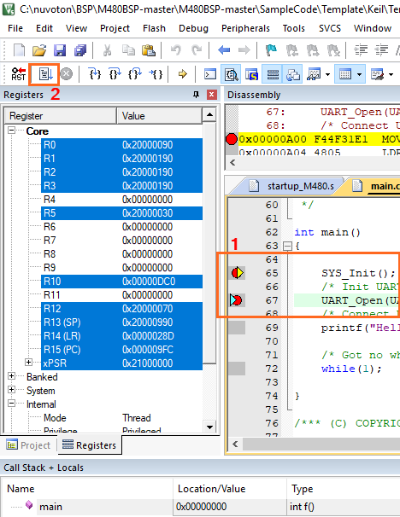
| 1. | Open the Template.uvproj in M480 BSP, as shown in Figure 1 | |
|
Figure 1 Open M480 Project |
||
| 2. | Configure the NuTrace | |
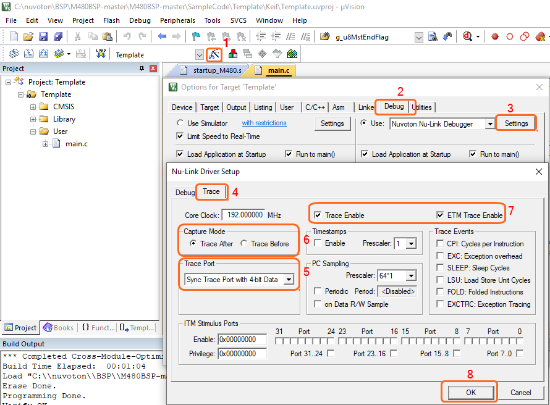
| • | As shown in Figure 2, in debug setting dialog, select the Trace tab. | |
| • | In Trace Port select Sync Trace Port with 4 bit data. It is possible to use other bit sizes but best to use the largest to increase the bandwidth. | |
| • | In Capture Mode, specify whether trace data is collected before or after a trigger | |
| - Trace After: Capture the trace information after the trigger point and stop capturing when trace buffer is full | ||
| - Trace Before: Capture the most recent trace information before CPU is stopped. | ||
| • | Select Trace Enable and ETM Trace Enable. | |
| • | Click OK to save the changes. | |
|
Figure 2 Trace Setup with ETM |
||
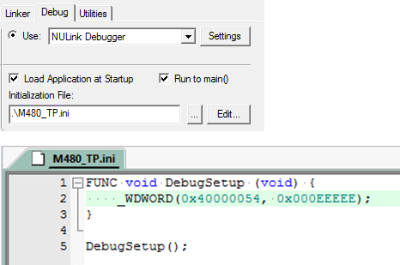
| 3. | In Initialization File, please insert a script file to initialize the device’s trace pins when starting the debugger. The following is an example script file. | |
|
Figure 3 Initialize File for Trace Pin Note: The Nu-Link Keil driver with the version v2.07 or later will automatically setup the trace pins when starting the debugger. The user does not need to do the above configuration. |
||
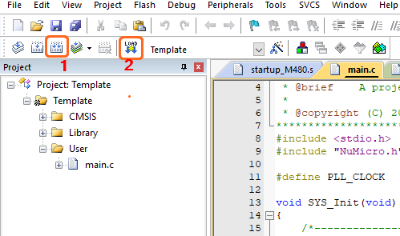
| 4. | Build and download code to the target chip, as shown in Figure 4. | |
|
Figure 4 Build and Download Windows for ETM |
||
| 5. | After doing above settings, user must start the debugger. In Debug mode, please select Debug -> NuTrace to invoke the tracing information dialog, and it will show every single executed instruction in the current application as shown in Figure 5. | |
|
Note: As shown in Figure 6, It is recommended to set a break point or use single-step execution, it will be easier to track the status of the program.
Figure 5 Tracing Information Dialog
Figure 6 Breakpoint Setting and Execution |
||
